This article is based on a poster originally authored by Jing Lai, Gang Yang, Yushi Cao, Xuehua Zhang, Yi Li, Bojia Liu, Youpeng Yang, Ning Yang and Mandy Xu.
Introduction
Sulfonation (also known as sulfurylation) is a significant phase II conjugation reaction that occurs throughout the metabolism of both xenobiotics and endogenous substances.
It is catalyzed by sulfotransferases (SULT). In humans, the eighteen SULT genes are divided into five gene families.
Recognizing the metabolic phenotyping and inhibition of sulfotransferases is essential for analyzing drug-drug interactions during drug discovery and development.
Conventional probe substrates, such as 4-nitrophenol and dopamine, frequently require ion-pairing reagents and can damage instruments, rendering them unsuitable for high-throughput LC-MS/MS analysis.
To address these constraints, this study utilized new probe substrates, developing a panel of in vitro phenotyping and inhibition tests to characterize SULT1A1, SULT1A2, SULT1A3, SULT1B1, SULT1E1, and SULT2A1 via recombinant enzymes and optimized LC-MS/MS methodologies.
Methods
LC-MS/MS method development
- Optimized settings for SULT substrate and metabolite measurement (Part 1).
Enzyme kinetics
- Screened SULT values ranged from two to 100 μg/mL.
- Optimized incubation period (5-60 min) for substrate depletion and product production.
- Determined Km of 4-Methylumbelliferone, 1-Naphthol, 17β-Estradiol, and Dehydroepiandrosterone.
Inhibitor profiling
- Determined IC50 values for quercetin, resveratrol, DCNP, baicalein, triclosan, and testosterone.
- Analyzed curves with GraphPad Prism (v9.0).
LC-MS/MS method development for substrates and metabolites
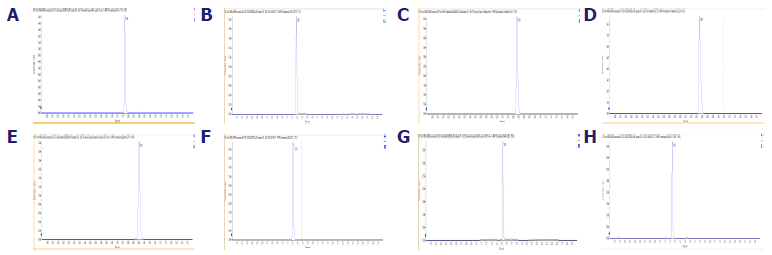
A: 4-MU. B: 4-MUS. C: 1-Naphthol. D: 1-Naphthol Sulfate. E: 17β-Estradiol. F: E2S. G: DHEA. H: DHEAS. The chromatograms of the analytes resolved by the established LC‐MS/MS methods. Image Credit: Pharmaron
Source: Pharmaron
|
Compound name
|
Q1
(m/z)
|
Q3
(m/z)
|
Column
|
Mobile phase
|
|
A
|
B
|
|
4-Methylumbelliferone
(4-MU)
|
177.185
|
77.123
|
XSelect HSS T3 2.5 μm
2.1×50 mm
|
0.1 % formic
acid in water
|
0.1 % formic acid
in acetonitrile
|
|
4-Methylumbelliferyl
sulfate (4-MUS)
|
257.5
|
177.2
|
XSelect HSS T3 2.5 μm
2.1×50 mm
|
0.1 % formic
acid in water
|
0.1 % formic acid
in acetonitrile
|
|
1-Naphthol
|
143.2
|
115.2
|
ACQUITY UPLC BEH C18 1.7 μm 2.1×30 mm
|
0.1 % aqueous
ammonia in water
|
0.1 % aqueous
ammonia in methanol
|
|
1-Naphthol
sulfate
|
222.899
|
142.96
|
ACQUITY UPLC BEH C18 1.7 μm 2.1×30 mm
|
0.1 % aqueous
ammonia in water
|
0.1 % aqueous
ammonia in methanol
|
|
17β-Estradiol
|
271
|
145
|
ACQUITY UPLC BEH C18 1.7 μm 2.1×30 mm
|
0.1 % aqueous
ammonia in water
|
0.1 % aqueous
ammonia in methanol
|
|
17β-Estradiol
sulfate (E2S)
|
351.1
|
271.2
|
XSelect HSS T3 2.5 μm
2.1×50 mm
|
2.5 mM CH3COONH4 in water
|
Acetonitrile
|
|
Dehydroepiandrosterone
(DHEA)
|
289.3
|
253.4
|
XSelect HSS T3 2.5 μm
2.1×50 mm
|
2.5 mM CH3COONH4 in water
|
Acetonitrile
|
|
Dehydroepiandrosterone
sulfate (DHEAS)
|
367.1
|
97
|
XSelect HSS T3 2.5 μm
2.1×50 mm
|
2.5 mM CH3COONH4 in water
|
Acetonitrile
|
SULT protein concentration and incubation time determination
Source: Pharmaron
|
SULT isoform
|
Substrate
|
Substrate
conc. (μM)
|
Protein
conc. (μg/mL)
|
Remaining percentage %
|
t1/2 (min)
|
Clearance
(μL/min/μg)
|
|
0.5 min
|
5 min
|
15 min
|
30 min
|
45 min
|
60 min
|
|
Human SULT1A1
|
4-MU
|
1
|
50
|
100
|
71.00
|
31.25
|
20.57
|
19.15
|
17.08
|
12.86
|
1.08
|
|
Human SULT1A2
|
1-Naphthol
|
1
|
20
|
100
|
80.43
|
47.83
|
15.22
|
4.35
|
4.35
|
10.83
|
3.20
|
|
Human SULT1A3
|
1-Naphthol
|
1
|
20
|
100
|
85.57
|
60.21
|
35.21
|
19.14
|
10.71
|
18.44
|
1.88
|
|
Human SULT1B1
|
1-Naphthol
|
1
|
20
|
100
|
82.38
|
51.08
|
15.69
|
7.85
|
3.92
|
11.00
|
3.15
|
|
Human SULT1E1
|
17β-Estradiol
|
1
|
20
|
100
|
81.34
|
40.92
|
3.35
|
3.10
|
2.45
|
7.78
|
4.46
|
|
Human SULT2A1
|
DHEA
|
1
|
50
|
100
|
91.29
|
60.86
|
37.75
|
20.33
|
11.62
|
18.94
|
0.73
|
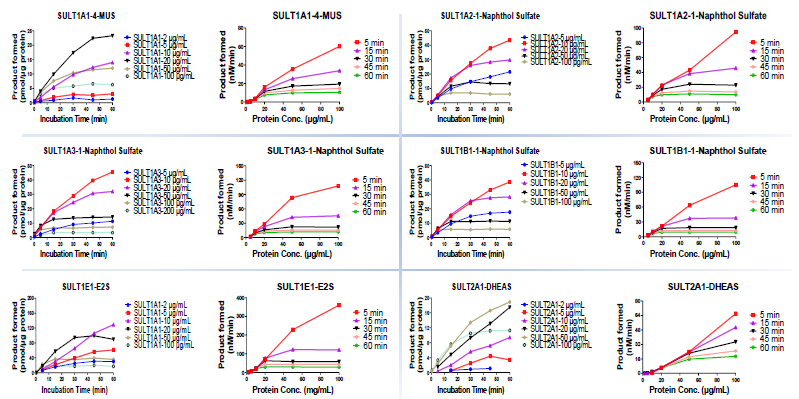
Image Credit: Pharmaron
Km determination
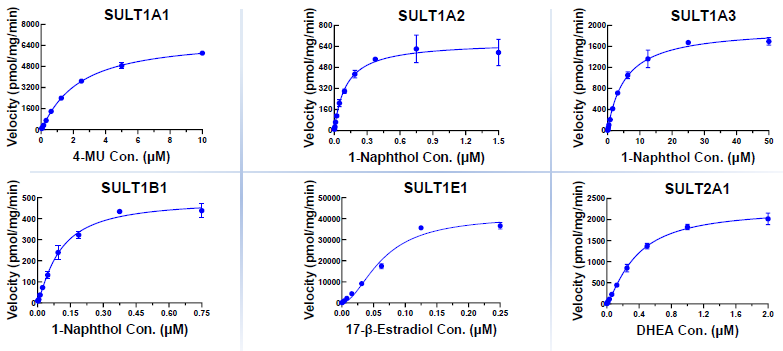
Image Credit: Pharmaron
Source: Pharmaron
|
SULT isoform
|
Probe
substrate
|
Incubation time
|
Protein conc.
|
Km
|
|
(min)
|
(μg/mL)
|
(μM)
|
|
Human SULT1A1
|
4-MU
|
5
|
50
|
1.87
|
|
Human SULT1A2
|
1-Naphthol
|
5
|
5
|
0.14
|
|
Human SULT1A3
|
1-Naphthol
|
5
|
10
|
4.56
|
|
Human SULT1B1
|
1-Naphthol
|
5
|
5
|
0.17
|
|
Human SULT1E1
|
17β-Estradiol
|
5
|
20
|
0.12
|
|
Human SULT2A1
|
DHEA
|
5
|
50
|
0.33
|
SULT inhibition assay
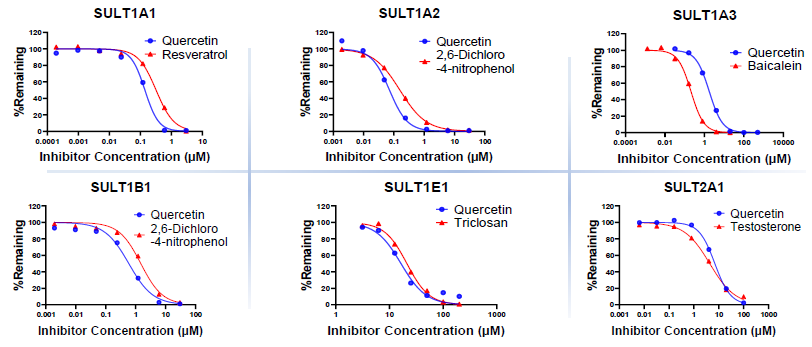
Image Credit: Pharmaron
Source: Pharmaron
|
SULT isoform
|
Probe
substrate
|
Incubation time
|
Protein conc.
|
Probe substrate conc.
|
Inhibitor
|
IC50 (μM)
|
|
(min)
|
(μg/mL)
|
(μM)
|
|
(μM)
|
|
Human SULT1A1
|
4-MU
|
5
|
50
|
1
|
Quercetin
|
0.16
|
|
Resveratrol
|
0.29
|
|
Human SULT1A2
|
1-Naphthol
|
5
|
5
|
0.1
|
Quercetin
|
0.04
|
|
DCNP
|
0.13
|
|
Human SULT1A3
|
1-Naphthol
|
5
|
10
|
3
|
Quercetin
|
1.76
|
|
Baicalein
|
0.21
|
|
Human SULT1B1
|
1-Naphthol
|
5
|
5
|
0.1
|
Quercetin
|
0.46
|
|
DCNP
|
1.3
|
|
Human SULT1E1
|
17β-Estradiol
|
5
|
20
|
0.05
|
Quercetin
|
13.55
|
|
Triclosan
|
27.77
|
|
Human SULT2A1
|
DHEA
|
5
|
50
|
0.3
|
Quercetin
|
7.65
|
|
Testosterone
|
2.72
|
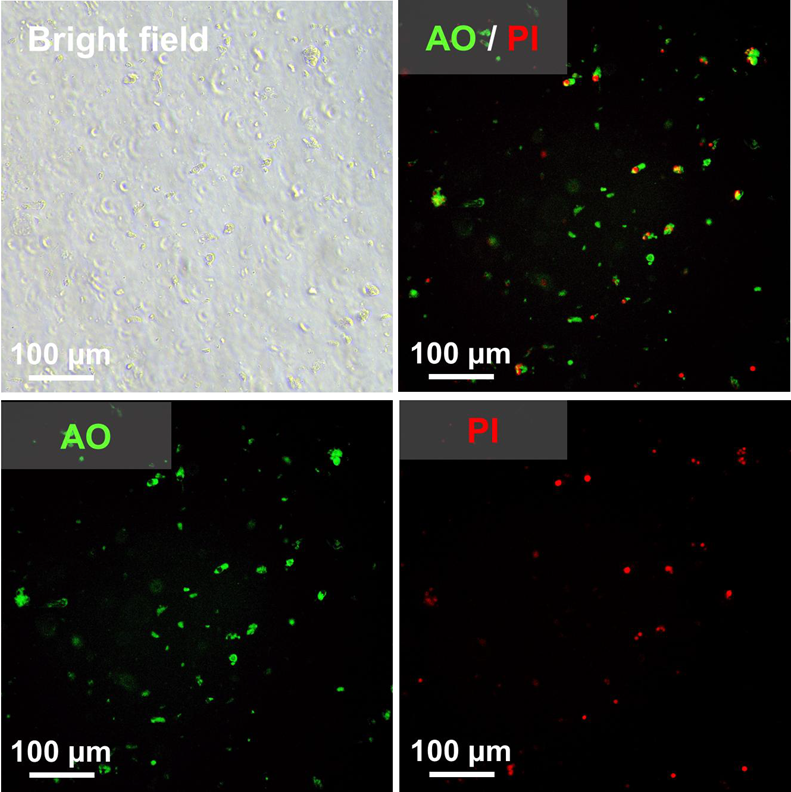
Image Credit: Pharmaron
Morphology and viability of isolated rat jejunal enterocytes: Enterocytes were separated from rat jejunum using EDTA-mediated calcium chelation and then stained with acridine orange (AO) to pinpoint living cells and propidium iodide (PI) to identify dead cells.
P-gp abundance in membrane proteins of Caco-2 and rat enterocytes
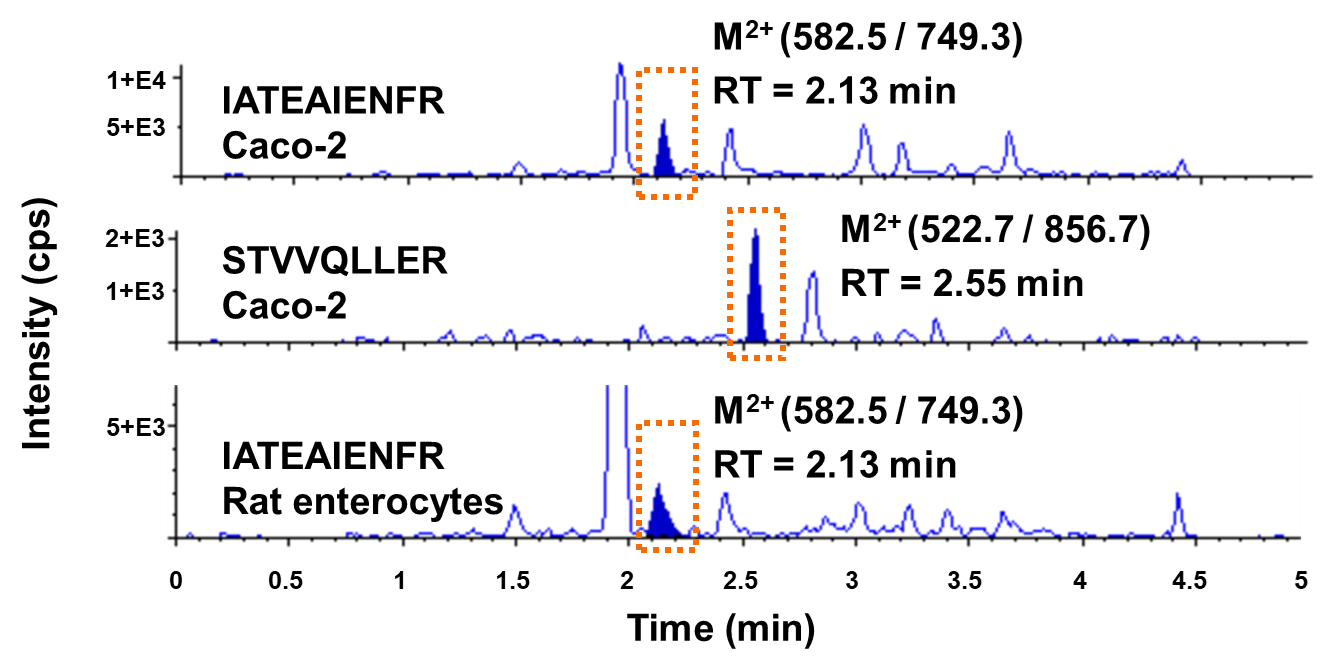
LC-MS/MS MRM chromatograms of surrogate peptides in Caco-2 and isolated rat enterocyte membrane samples. Image Credit: Pharmaron
P-gp quantification in Caco-2 and rat enterocyte membranes. Source: Pharmaron
|
Cell types
|
Surrogate peptide
|
P-gp abundance (fmol/μg)
|
|
Replicates
|
Average
|
CV %
|
|
Caco-2
|
IATEAIENFR
|
1.39
|
1.48
|
8.6 %
|
|
1.57
|
|
STVVQLLER
|
1.24
|
1.17
|
9.1 %
|
|
1.09
|
|
Rat enterocytes
|
IATEAIENFR
|
0.86
|
0.75
|
19.7 %
|
|
0.65
|
|
|
|
|
|
|
Conclusion
The researchers in this study designed and validated LC-MS/MS-based phenotyping assays for SULT1A1, SULT1A2, SULT1A3, SULT1B1, SULT1E1, and SULT2A1. These assays allow for the assessment of compound substrate potential towards various SULT enzymes.
To improve the accuracy and throughput of SULT inhibition tests, probe substrates were selected and adjusted for each enzyme.
The relevant LCMS/MS procedures were also optimized. Key parameters such as probe substrate Km and IC50 values, as well as appropriate protein concentrations for recombinant SULT enzymes, were identified.
The validated in vitro SULT phenotyping and inhibition assays are now ready for use in evaluating compounds of interest during drug discovery and development.
References
- Mulder, G.J. (1990) Conjugation Reactions in Drugs Metabolism An Integrated Approach Substrates. Co-Substrates. Enzymes and Their Interactions in Vivo and in Vitro. Taylor and Francis, Abingdon-on-Thames, 413 p. - References - Scientific Research Publishing. (online) Available at: https://www.scirp.org/%28S%28mllvtr455ztxky45opcgzyis%29%29/reference/referencespapers?referenceid=2317977.
- Weinshilboum, R.M. (1986). Phenol sulfotransferase in humans: properties, regulation, and function. Federation proceedings, (online) 45(8), pp.2223–8. Available at: https://pubmed.ncbi.nlm.nih.gov/2873064/.
- Falany, C.N. (1991). Molecular enzymology of human liver cytosolic sulfotransferases. Trends in Pharmacological Sciences, 12, pp.255–259. DOI: 10.1016/0165-6147(91)90566-b. https://www.sciencedirect.com/science/article/pii/016561479190566B?via%3Dihub.
- Michael W.H. et al. (1998). Biology and function of the reversible sulfation pathway catalysed by human sulfotransferases and sulfatases. Chemico-Biological Interactions, 109(1-3), pp.3–27. DOI: 10.1016/s0009-2797(97)00117-8. https://www.sciencedirect.com/science/article/abs/pii/S0009279797001178?via%3Dihub.
- Kurogi, K., et al. (2021). SULT genetic polymorphisms: physiological, pharmacological and clinical implications. Expert Opinion on Drug Metabolism & Toxicology, 17(7), pp.767–784. DOI: 10.1080/17425255.2021.1940952. https://www.tandfonline.com/doi/full/10.1080/17425255.2021.1940952.
About Pharmaron
Pharmaron (Stock Code: 300759.SZ/3759.HK) is a premier R&D service provider for the life sciences industry. Founded in 2004, Pharmaron has invested in its people and facilities, and established a broad spectrum of research, development and manufacturing service capabilities throughout the entire drug discovery, preclinical and clinical development process across multiple therapeutic modalities, including small molecules, biologics and CGT products. With over 17,000 employees, and operations in China, the U.S., and the U.K., Pharmaron has an excellent track record in the delivery of R&D solutions to its partners in North America, Europe, Japan and China.
Sponsored Content Policy: News-Medical.net publishes articles and related content that may be derived from sources where we have existing commercial relationships, provided such content adds value to the core editorial ethos of News-Medical.Net which is to educate and inform site visitors interested in medical research, science, medical devices and treatments.
Last Updated: Jan 9, 2026